The ultimate Hiking Time Calculator
This tool calculates your estimated hiking time based on distance, elevation gain and loss, trail conditions, maximum altitude, and your fitness level. Your pace and the total time of your hike are calculated based on Pharoah’s function with modified Tranter’s corrections, and alternatively using a corrected version of Naismith’s rule, as well as book time.
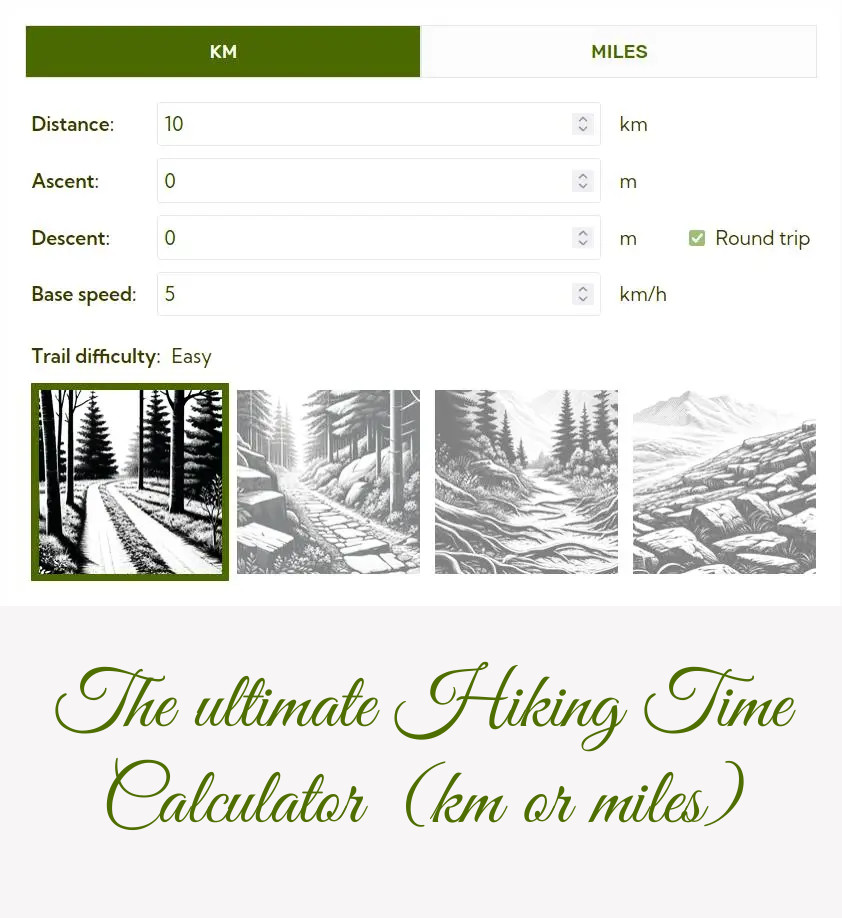
Hiking Time Calculator
Simply enter your hike’s distance as well as altitude gain and loss in the calculator above. When “round trip” is checked, the altitude loss is set to the entered altitude gain.
Base speed is your normal walking speed on level, even ground – the average person walks at about 5 km/h or 3 MPH. When hiking in a group, input the slowest person’s speed.
For increased accuracy, you can input the weight of your backpack, the altitude at which you’ll be hiking, as well as the trail difficulty – is it an easy road, or a tough terrain full of roots and rocks to climb over?
The calculation assumes that altitude gain & loss are equally distributed over the distance. If your hike has long flat sections and consequently steeper slopes for a given altitude gain, you can enter the percentage of the distance which is flat to account for the more strenuous climbs. The effect is typically small, so don’t worry if you don’t know this value.
The resulting hiking time is the best estimate of how long this hike will take, not counting breaks. The book time is a very high estimate; you can be pretty sure to be faster than this. Corrected Naismith’s time is displayed mainly for people who are curious how the different estimates compare; but if you tend to be slower than the average hiker on steep climbs, you are likely closer to the corrected Naismith time than to our main estimate.
What is a normal hiking speed and pace?
Let’s first clarify some basic terms:
- Speed is distance travelled per time, measured in kilometers per hour or miles per hour (MPH).
- Pace is time needed to travel a certain distance, measured in min/km or min/mile.
Thus, pace is the inverse of speed, and is measured w.r.t. minutes rather than hours. Therefore, you can convert between speed and pace as follows:
For example, a speed of 5 km/h corresponds to a pace of (60 min/h) / (5 km/h) = 12 min/km. (A neat trick to make sure you’re using formulas correctly: Make sure the units cancel out to what you want! In this example, the 1/h on both sides cancel out to leave only the min per km.)
The typical walking speed for an average, somewhat fit human on flat, even ground is 5 km/h ≈ 3 MPH, which corresponds to a pace of 12 min/km ≈ 20 min/mile. This speed is influenced by various circumstances: Gentle downward slopes increase it to about 6 km/h, uphill slopes and steep downhills decrease walking speed. Uneven or soft ground reduces speed, so does bad weather, strong headwind, fatigue, lower fitness, and pack weight. We will see in more detail by how much down below.
Methods to estimate hiking time
There are quite a few rules of thumb for estimating hiking pace and time – and they give horrendously inconsistent estimates, especially for downhill sections. What follows is a somewhat nerdy deep-dive into the rabbit hole of figuring out which method is the most reliable and worthy of using in our calculator – feel free to skip it if you don’t like formulas.
Naismith’s Rule
Naismith’s Rule is a classic rule of thumb for estimating hiking times, devised by Scottish climber W. Naismith in 1892. Naismith’s rule states that your hike will take one hour per 3 miles, plus an additional 30 minutes per 1000 feet of climb – or in metric units, one hour per 5 km plus an extra 30 minutes per 300 m of climb.
Naismith’s rule is the most popular method for estimating hiking time. It’s main appeal is its simplicity, as you can perform the calculation quickly in your head.
The dependence of speed on slope according to Naismith looks like this:
However, the simple, linear approach of Naismith’s rule fails to take into account a number of factors which affect your pace:
- Trail difficulty: Walking speed decreases on difficult trails, where you have to carefully think about every step, climb over roots, etc. Considering Naismith was a mountaineer, it is safe to assume he meant his rule for at least medium to hard difficulty trails.
- Fitness: A more in-shape hiker will obviously be faster and fatigue more slowly.
- Fatigue: Hiking speed slows down over the course of the day, especially if you are not used to hikes of the same distance – this effect is not included at all.
- Downhill sections: It is unclear whether Naismith meant to imply that the time taken to hike back down a mountain is included in the extra time allocated for hiking up, or he simply assumes downhill pace to be equal to pace on flat ground. (On round trips, this distinction is irrelevant – but what about an A-to-B climb?)
- Altitude: The higher you get, especially above 2000m, the thinner the oxygen becomes. Especially for non-acclimated people, this results in a significant slow-down.
As you can see, while Naismith’s rule makes for a decent rule of thumb, it is not meant to be more than a rough rule of thumb. For our calculator to be reliable, we need something better!
Tranter’s corrections
Tranter proposed in 1965 a number of corrections to Naismith’s rule, which take into account the hiker’s fitness and fatigue, as well as external circumstances such as weather conditions, pack weight, trail quality, etc. The “fitness” number is based on the time in minutes it takes the subject to climb 1000 feet (300 m) over a 0.5 mile (800 m) distance.
| Fitness | Time taken according to Naismith’s rule (in h) | |||||||||||||||
| (in min) | 2 | 3 | 4 | 5 | 6 | 7 | 8 | 9 | 10 | 12 | 14 | 16 | 18 | 20 | 22 | 24 |
| 15 | 1 | 1.5 | 2 | 2.75 | 3.5 | 4.5 | 5.5 | 6.75 | 7.75 | 10 | 12.5 | 14.5 | 17 | 19.5 | 22 | 24 |
|---|---|---|---|---|---|---|---|---|---|---|---|---|---|---|---|---|
| 20 | 1.25 | 2.25 | 3.25 | 4.5 | 5.5 | 6.5 | 7.75 | 8.75 | 10 | 12.5 | 15 | 17.5 | 20 | 23 | ||
| 25 | 1.5 | 3 | 4.25 | 5.5 | 7 | 8.5 | 10 | 11.5 | 13.25 | 15 | 17.5 | |||||
| 30 | 2 | 3.5 | 5 | 6.75 | 8.5 | 10.5 | 12.5 | 14.5 | ||||||||
| 40 | 2.75 | 4.25 | 5.75 | 7.5 | 9.5 | 11.5 | Too much to be attempted | |||||||||
| 50 | 3.25 | 4.75 | 6.5 | 8.5 | ||||||||||||
In bad weather conditions, on difficult trails, as well as for every 20 kg (44 lbs) of pack weight, you drop down one fitness row in this table.
The correction for a given fitness level takes into account that one becomes more fatigued and slower as time goes on.
Although Tranter’s corrections are frequently cited, I have not been able to locate the original source; it seems they were popularized by Eric Langmuir in his 1969 book Mountaincraft and Leadership. As such, it is difficult to figure out the reasoning behind these numbers.
As Dave Roberts correctly points out, the assumption that a person’s fitness over a short 800 m climb is particularly correllated with their performance over, say, 20 km is haphazard at best. There are experienced endurance athletes who are bad at sprints, and excellent sprinters who won’t keep up well on a long-distance backpacking trip.
What’s more, the influence of fatigue on hiking speed is not nearly as strong as this table predicts, according to experimental data examined by Paul Pharoah (we will return to this paper later).
There is, however, one aspect in which Tranter’s corrections hold up to real-life hiking experience and are of practical use, that is, the adjustments for pack weight and trail conditions. Every trail difficulty level and every 44 lbs (20 kg) of weight you carry, you drop down by one fitness level. (Let us simplify things by treating bad weather conditions as increasing the trail difficulty level by one.)
This calculator uses a similar correction, but does not make it clear how much is meant by, for example, “heavy weight” or “fast intended pace”, and why said corrections should correspond to 10% sifts in hiking time. Let us therefore try and quantify these influences as accurately as possible!
Adapting Tranter’s correction for trail difficulty and weight
Now, finding the correct adjustments corresponding to such drops in “fitness level” in the table of Tranter’s corrections would be rather annoying and imprecise, since the table only provides a few discrete data points. Let us therefore peruse the extrapolation of Tranter’s table derived by Markus Mayer, which gives a fairly close reproduction of the table entries:
where tN is the time predicted by Naismith’s rule, tcorr is the extrapolated time according to Tranter’s correction, and f is the fitness in minutes.
Now, we are interested in the effect of dropping one fitness level on the corrected time. To this end, we need to also extrapolate the fitness number in terms of the “fitness level” (i.e., the row number in the table). The fitness levels correspond to 15, 20, 25, 30, 40, and 50 minutes respectively; note the sudden jump from 5-minute steps to 10-minute steps. However, for our application, it is more useful to look at the fraction fi+1 / fi rather than the difference between these fitness numbers:
which is pretty consistent! The average fraction between subsequent fitness numbers is 1.273333. We can therefore approximate, if we denote the best fitness level (corresponding to f = 15 min) by i = 0 and the subsequent ones by i = 1, 2, 3…, that
giving us the new, extrapolated fitness numbers fi listed in the following table and compared to the original values f:
| i | 0 | 1 | 2 | 3 | 4 | 5 |
|---|---|---|---|---|---|---|
| f (min) | 15 | 20 | 25 | 30 | 40 | 50 |
| fi (min) | 15 | 19.1 | 24.3 | 30.1 | 39.4 | 50.1 |
| Error (min) | 0 | -0.9 | -0.7 | 0.1 | -0.6 | 0.1 |
Close enough to the original levels! Now we can finally figure out the effect of dropping one fitness level by expressing the extrapolated corrected time in terms of i,
Now, “dropping one fitness level” corresponds to increasing i by one in the above formula – in other words, multiplying the estimated time by 1.217. In other words, for every trail difficulty level, as well as for every 30 lbs of extra weight carried, multiply the estimated hiking time by 1.217, or equivalently, multiply pace by 0.822.
Aitken corrections
Aitken proposed a correction to Naismith’s rule to account for different ground surface, which assumes that walking speed is 3 MPH (5 km/h) on roads, tracks and even paths, and 2.5 MPH (4 km/h) on all other surfaces. Considering the context of his PhD thesis in which he states these numbers, we can assume that “all other surfaces” corresponds to medium-difficulty trails for our purposes.
Let’s compare this to our adaptation of Tranter’s corrections. According to the previous section, the increase in difficulty by moving from roads to medium-level trails (1 level) corresponds to multiplying speed by 0.822, so we get 5 km/h * 0.822 = 4.11 km/h, very close to Aitken’s correction! It looks like we’re on the right path here.
For tough trails, our extrapolated Tranter’s correction with a base speed of 5 km/h predicts a speed of 3.4 km/h; and I can say from experience that tough trails easily slow me down to this extent. It is therefore safe to assume that we may treat Aitken’s corrections as a special case of the extrapolated Tratner’s correction, which only applies up to medium-hard trails.
Langmuir’s corrections
Langmuir’s corrections to Naismith’s rule adjust for the pace on downhill slopes by
- substracting 10 min per 300 m descent on slopes of -5° to -12°,
- and adding 10 min per 300 m descent on slopes steeper than -12°.
While it makes intuitive sense that one would be able to walk faster on a gentle downhill slope, this rule does not seem applicable to the average hiker for two reasons:
- The function of pace vs. slopes is extremely discontinuous – assuming a base speed of 5 km/h, it predicts a hiking speed of 12 km/h on a -12° slope, suddenly dropping to 3 km/h on a -12.1° slope.
- Considering that the maximum comfortable walking speed is about 9 km/h, the maximum speed of 12 km/h appears unrealistic.
This becomes really apparent when plotting hiking speed according to Langmuir against slope (in °):
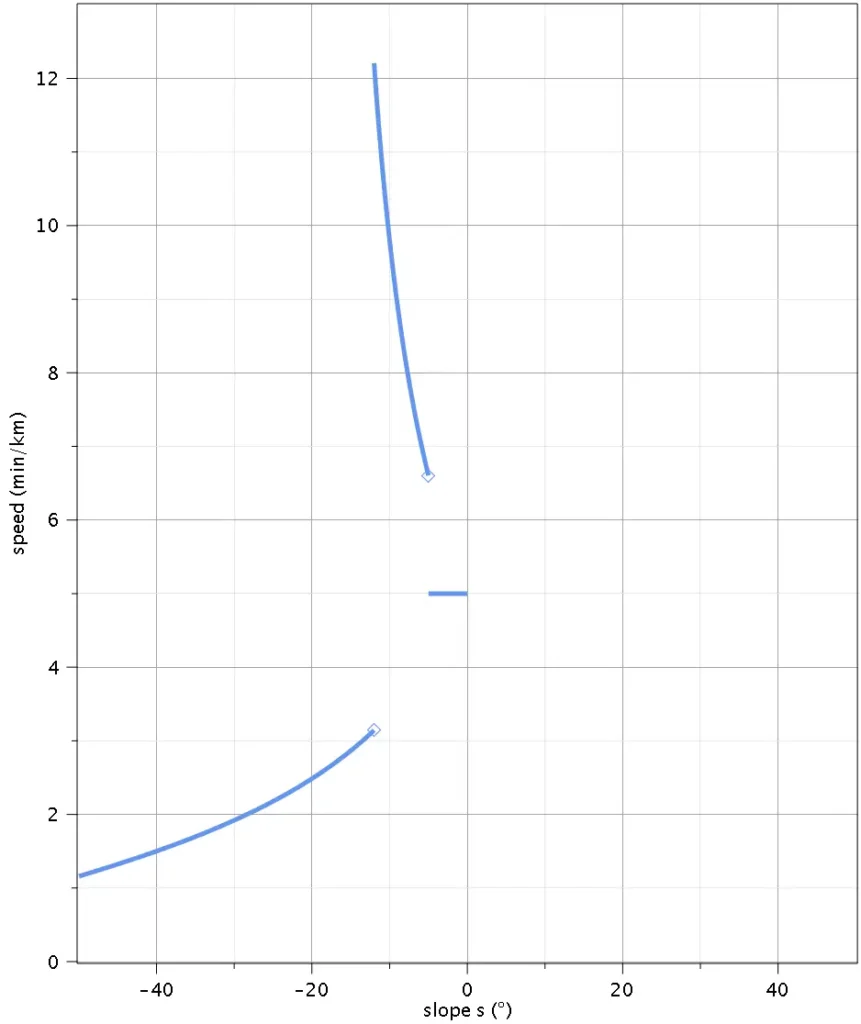
The only situation in which this makes sense would be someone breaking into a jog on gentle downhills; not an assumption one would make for a typical hike.
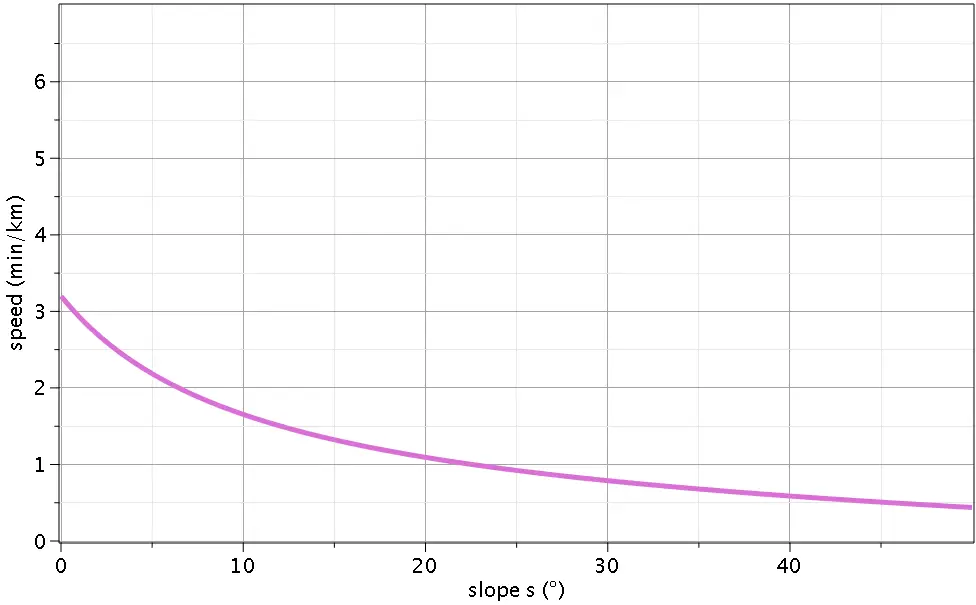
Tobler’s hiking function
Tobler’s hiking function is an exponential function predicting hiking speed depending on slope, given by
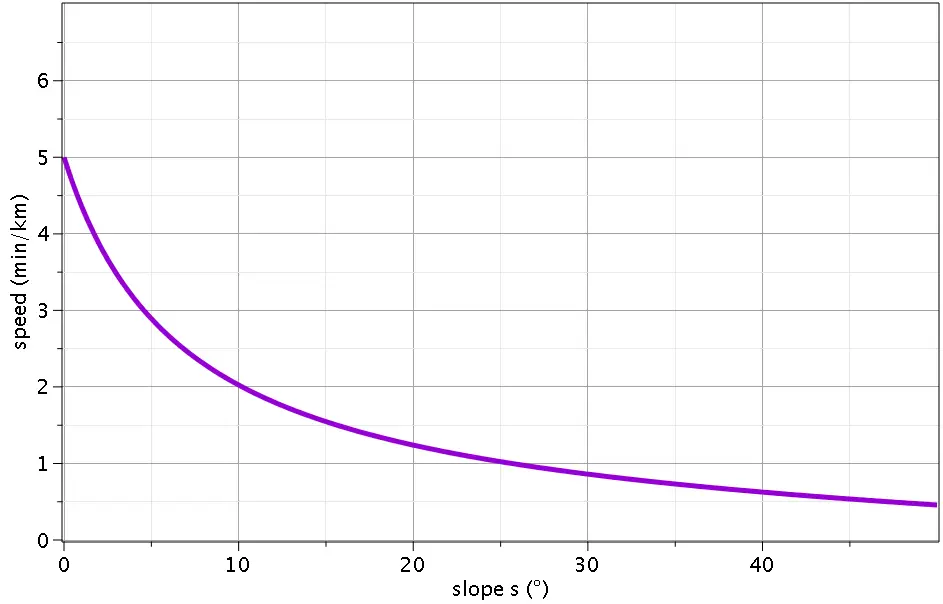
where s is the slope in degrees, and V is the resulting speed. The plot of dependence of hiking speed on slope according to Tobler’s function is as follows:
For uphill slopes, these velocity values are fairly similar to Naismith’s predictions. Tobler’s function predicts the maximum speed at a gentle downhill slope of about -3°, which seems reasonable.
Munter Method
The Munter Method is a technique for calculating backcountry travel time developed by alpinist Werner Munter, which takes into account the hiking distance, ascent, and rate of travel. The latter is the crux of this method – it is a number from 2 to 6, which you have to choose wisely depending on your situation: 2 corresponds to slow movement in tough terrain, 4 to walking uphill, 6 to walking downhill (in fact, his scale goes up to 10 for skiing downhill, but this is irrelevant for our current considerations). The estimated time tM is then calculated as
You’ll notice that this is very similar to Naismith’s time tN , which can be written equivalently as
We see that Naismith’s rule assumes an average rate of 5 and a somewhat smaller relative slow-down from altitude gain compared to Munter’s method. However, it gets more complicated:
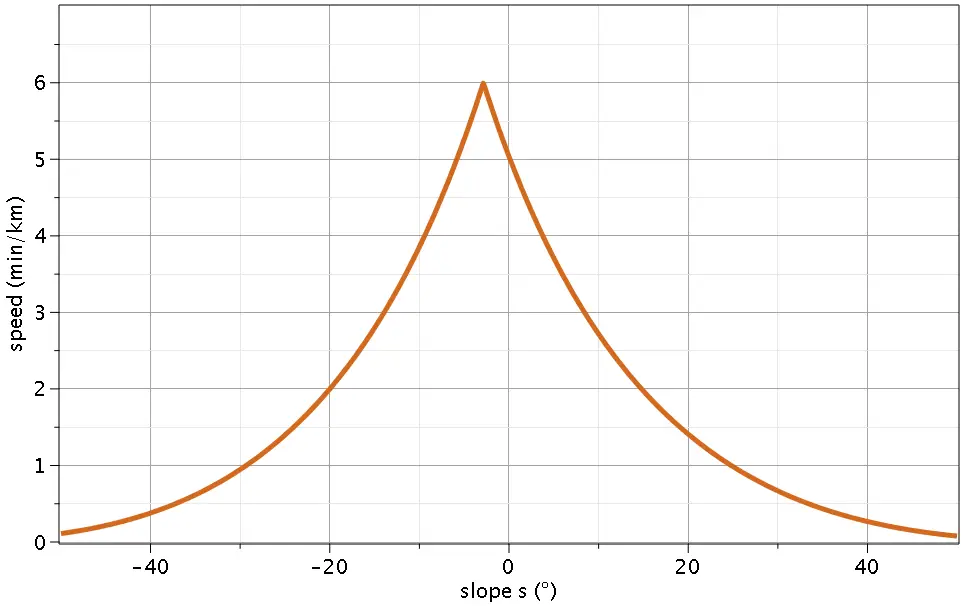
Munter’s rate is variable, and also dependent on slope! Obviously the rate is supposed to vary depending on terrain and other factors, but for the purpose of being able to plot predictions derived from the Munter method, let us assume that rate = 6 – abs(s/10+1). This comes out at a rate of 4 for 10° uphills, a maximum rate of 6 for -10° downhills, and smaller rates for steep terrain, e.g. a rate of 2 for 30° climbs. With this rough estimate, we obtain a speed vs. slope distribution which looks as follows:
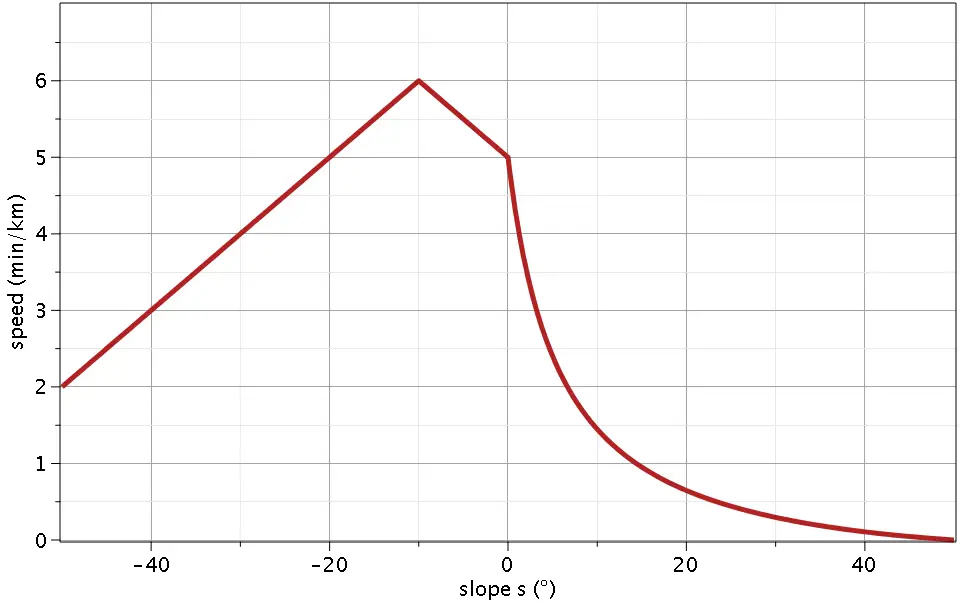
The Munter method seems to predict a much faster drop in speed on steep climbs compared to the previous estimates. This might be due to the inventor of this method, an alpinist, encountering more difficult, steep terrain than, say, the Scottish mountaineer Naismith.
We may take this as a reminder that we’re still just dealing with rules of thumb omitting certain details – for example, a trail containing several sudden, steep inclines will obviously take longer than a trail with the same altitude gain spread out evenly over the same distance.
Book time
Book time refers to a hiking time estimate often encountered in guide books, which is calculated as 30 minutes per mile, plus 30 minutes per 1000 feet of ascent, rounded to the nearest multiple of five minutes; or in equivalent terms to the estimates above,
Book time assumes an incredibly slow hiking speed of 3.2 km/h or 2 MPH on flat ground, but less increase in needed time for ascents, compared to the previous methods. This time is meant to be a very conservative estimate of the maximum time it will take to complete a fairly easy hike for not particularly fit people.
Pharoah’s Hiking function
So, which of this multitude of hiking time and pace predictions is the most accurate? This question has been addressed by sampling a large amount of real-life GPS data collected from experienced hikers in this paper by Pharoah.
To summarize the results, the best estimation of hiking pace among the methods discussed above is given by Tobler’s hiking function. However, Pharoah proposes a method which performs even better to describe the observed paces as a function of slope and altitude, in form of a linear spline function fitted to the collected data. According to Pharoah’s pace function, the hiking pace is given by
where S is the slope in %, defined as S = 100 · Δascent / Δdistance (note that in this case, a downhill (negative) slope S is understood to correspond to a negative amonut of ascent), and relates to the slope s in degrees as
The above formula omits a slight dependence of hiking pace on distance found by Pharoah.
Despite the intuitive expectation that a hiker would slow down over time due to fatigue, the experimental data instead showed a slight increase in speed at large (>20 km) distances. This is likely an artifact stemming from the fact that fitter & faster hikers tend to go on longer hikes, not due to people actually speeding up over time.
As for the dependence of hiking speed on trail slope, it predicts the following curve:
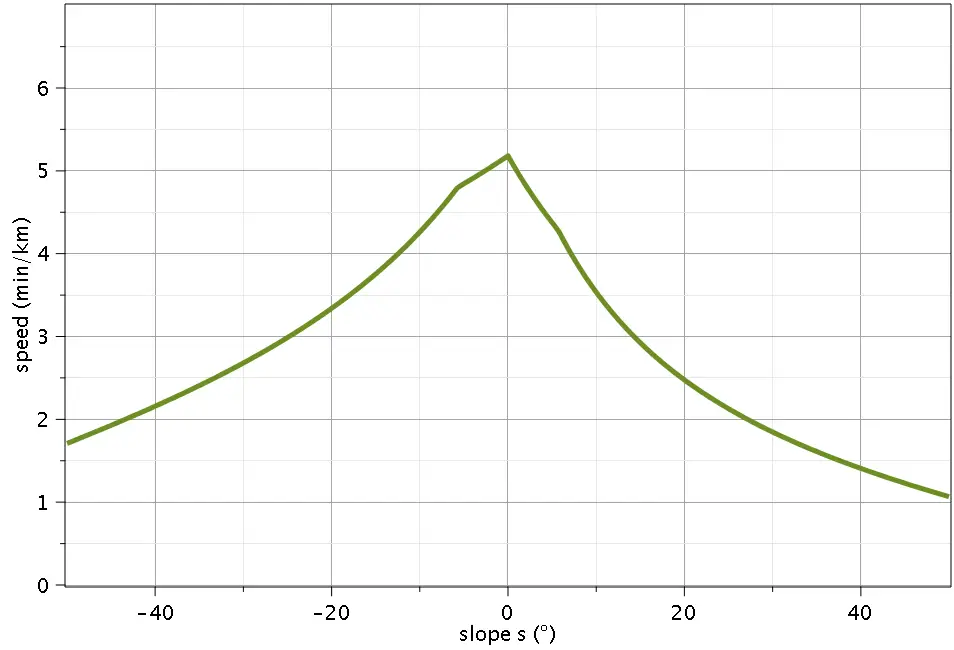
We can see that this speed function changes a lot more gently with slope than the previous contenders, in a way which seems realistic. The only potential complaint might be that implementing a node at a gentle -3° downhill slope instead of at 0 might capture the true maximum hiking speed and provide an even better fit; but it is unlikely that this would change hiking time estimates significantly.
In any case, considering that no significant slow-down is observed further into a hike, it is safe to assume in our calculations that that hiking speed is not significantly negatively impacted by fatigue.
Furthermore, this result provides an insight into the dependence of pace on altitude: You can expect to require an additional 0.93 min/km per km of altitude. For example, if a hiker moves at 12 min/km at sea level, they’d slow down to about 14 min/km on equivalent terrain at 2000 m altitude.
Pharoah’s function is fitted to the measured pace of the participating hikers while moving, meaning it makes zero allotment for breaks (as opposed to some of the above rules of thumb, especially book time, which take a typical, non-extensive amount of breaks into account).
Furthermore, the data is collected from experienced hikers – they are the most likely to gather und upload the GPS data of their adventures. (Then again, the same can be said for the inventors of the previously discussed rules of thumb.) We can therefore expect the hiking time estimate from Pharoah’s function to be on the lower end.
So,
Which is the best way to calculate hiking speed on a slope?
Let us compare the speeds predicted by all discussed hiking time estimation methods in a single plot:
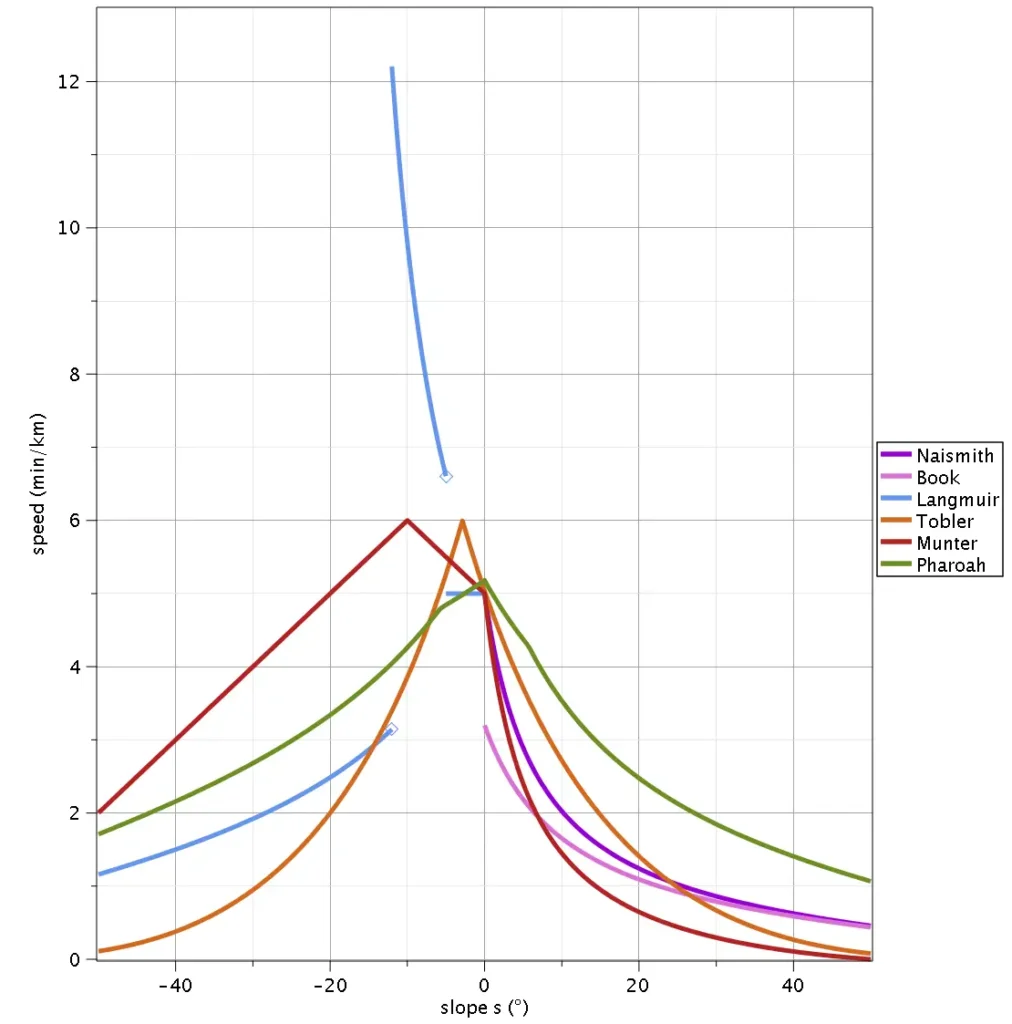
Except for the swift downhill jogs predicted by Langmuir’s corrections, all speed predictions are at least in the same order of magnitude! As expected, Pharoah’s function estimates relatively high speeds, especially for steeper slopes. On gentle 0 to -5° downhills, all methods predict a speed of at least 5 km/h; Pharoah’s function is likely to somewhat underestimate here, both since the experimental data likely includes people resting (which would register as flat ground), and due to the lack of node in their model at expected maximum speeds.
On the other hand, the sudden, intense peak in speed in this area predicted by Tobler’s hiking function up to 6 km/h is likely an overestimation; especially over longer distances, where knees get tired, and people are less likely to speed up this considerably on a downhill. All other methods give either no or a very rough estimate for gentle downhill slopes, so Pharoah’s function is still our best bet here.
Most methods address the slow-down on climbs, and agree to decent amount; with Pharoah’s function predicting the highest speeds by far.
Naismith’s rule stays neatly between book time and Pharoah’s time; it appears to actually be a very good predictor despite its simplicity. Where it does not match the experimental data provided by Pharoah, it underestimates speed; which is not necessarily a bad thing for less experienced hikers.
It is interesting that for round trips, where ascent equals descent, including Langmuir’s corrections to Naismith’s rule for slopes less than 12° essentially lifts average speed in this area much closer to Paroah’s function; this might be the reason this correction works in many cases.
Tobler’s hiking function is explicitly not intended for routes where you have to scramble – that is, climb using your hands; and indeed we see that it predicts the hiker coming to a stop where moving with 0.5-1 km/h would be much more realistic. Similarly, for very steep climbs Munter’s Method seems to predict too much of a slow-down; and is not very predictive for steeper downhills. (Of course, if you’ve figured out which rate to substitute in your specific circumstances, the Munter method might work great – but we’re talking about applicability to a calculator here.)
Based on these plots, it seems realistic to assume the following limits:
- Upper limit for speed: Pharoah’s function. While Pharoah’s function is likely underestimating speed on flat ground, over longer hikes it should average out to be a close match for a fit hiker’s speed. Tranter’s corrections for trail difficulty and pack weight, as well as scaling according to an individual’s base speed (to account for fitness levels) adapts the estimate to different circumstances.
- Lower limit for speed: Book speed. We know it is designed to give everyone enough time to comfortably complete a trail, and should thus be a (probably very) safe limit. Potential lower fitness levels are already included in this estimate; fitter people will be faster.
How we calculate hiking times
From the above considerations, we can extract rules on how various factors influence speed:
- Slope: The speed is estimated by Pharoah’s function; but at least equal to book speed.
- Altitude: For every km of altitude, 0.93 min/km should be added to the pace.
- Fatigue: Fatigue does not significantly change speed.
- Weight & Trail difficulty: For every trail difficulty level, and every 20 kg (44 lbs) of pack weight, speed is reduced by a factor of 0.822 (i.e. pace is multiplied by 1.22).
- Base speed: 5 km/h for the average, fit adult on flat ground.
It remains to decide the order of operations in which these effects are included in the final hiking time estimate. It appears logical that the additive pace increases caused by slopes and altitude should be scaled multiplicatively by the factors accounting for pack weight and trail difficulty, as well – not just the base pace. (For example, it makes sense for an extra 10 min needed for a given climb to turn into 12 minutes needed with a 20 kg backpack.)
An individual’s base pace could reasonably be substituted for the constant term in Pharoah’s function; however, it seems reasonable that someone who is able to walk 10% faster would also climb 10% faster. We shall therefore make base pace a multiplicative factor on the entire function, as well; and assume that the (rather fit) hikers from whom Pharoah’s data was collected had a base pace of 11.58. This assumption effectively scales the pace function to come out to base pace for an unencumbered hiker on flat, even ground.
Based on these findings, I propose the corrected Pharoah’s function for hiking pace:
where
How much time does it take to hike common distances?
On flat ground,
- A 5 km hike takes about 1 hour.
- A 10 km hike takes about 2 hours.
- A 15 km hike takes about 3 hours.
- A 20 km hike takes about 4 hours.
- A 25 km hike takes about 5 hours.
- A 30 km hike takes about 6 hours.
- A 35 km hike takes about 7 hours.
- A 5 mile hike takes about 2 hours.
- A 10 mile hike takes about 4 hours.
- A 15 mile hike takes about 6 hours.
- A 20 mile hike takes about 10 hours.